At Beta Analytics we provide free analysis of a multitude of different financial markets.
We hope we can provide some insight to how the markets are all interconnected and the cause and effect of daily price fluctuations. We believe our analysis is unbiased in nature and can show you the underlying message of each security and the likely direction that it will follow.
Along side Technical Analysis, we cover major news and fundamental releases including the effects on the various asset classes. Fundamental and Technical analysis are normally seen as two ways to trade. We try to combine the best of both and truly understand the markets.

Thursday, 13 December 2012

ES update

E-Mini S&P500 have fallen nearly 0.8% today after comments from Boehner, Reid and Pelosi. The daily candle from yesterday that clearly showed bearish technicals came true as said Here.

ES Daily. Thomson Reuters
Lets just hope there is no VWAP Bull$hit into the close...

Because the market looks like it could reverse slightly (short cover) We have closed 100% of shorts from 1430.50 at 1417.50


EDIT : As expected ES ramped up towards VWAP into the close and rose nearly 0.5% on Fiscal cliff talks. However after market trading ES has retraced a lot of the move to end the day at ~1419 +- 0.5

UK credit rating put on negative watch

* 13 December 2012 17:18:05 RTRS - S&P REVISES UNITED KINGDOM SOVEREIGN CREDIT OUTLOOK DOWN TO NEGATIVE FROM STABLE; CURRENT RATING IS AAA


GBP tick. Thomson Reuters.

GBP Instantly dropped on the news by nearly 40 pips. Now all 3 major Rating agencies have outlook as negative for the UK and Bank Of England.

However, argubaly one of the most controversial rating agencies, Egan Jones, Downgraded the UK earlier this year.

http://uk.reuters.com/article/2012/06/04/uk-unitedkingdom-rating-eganjones-idUKBRE8530ZR20120604

Egan Jones has been about 6 months ahead of action from other Ratings agencies in the past so expect a formal Downgrade in the coming weeks from either Moody's, Fitch or S&P.

Unfortunately this is not great for GBPNZD long but AUDUSD is doing well.

EDIT closed AUDUSD at 1.0520 for +55


GBPNZD

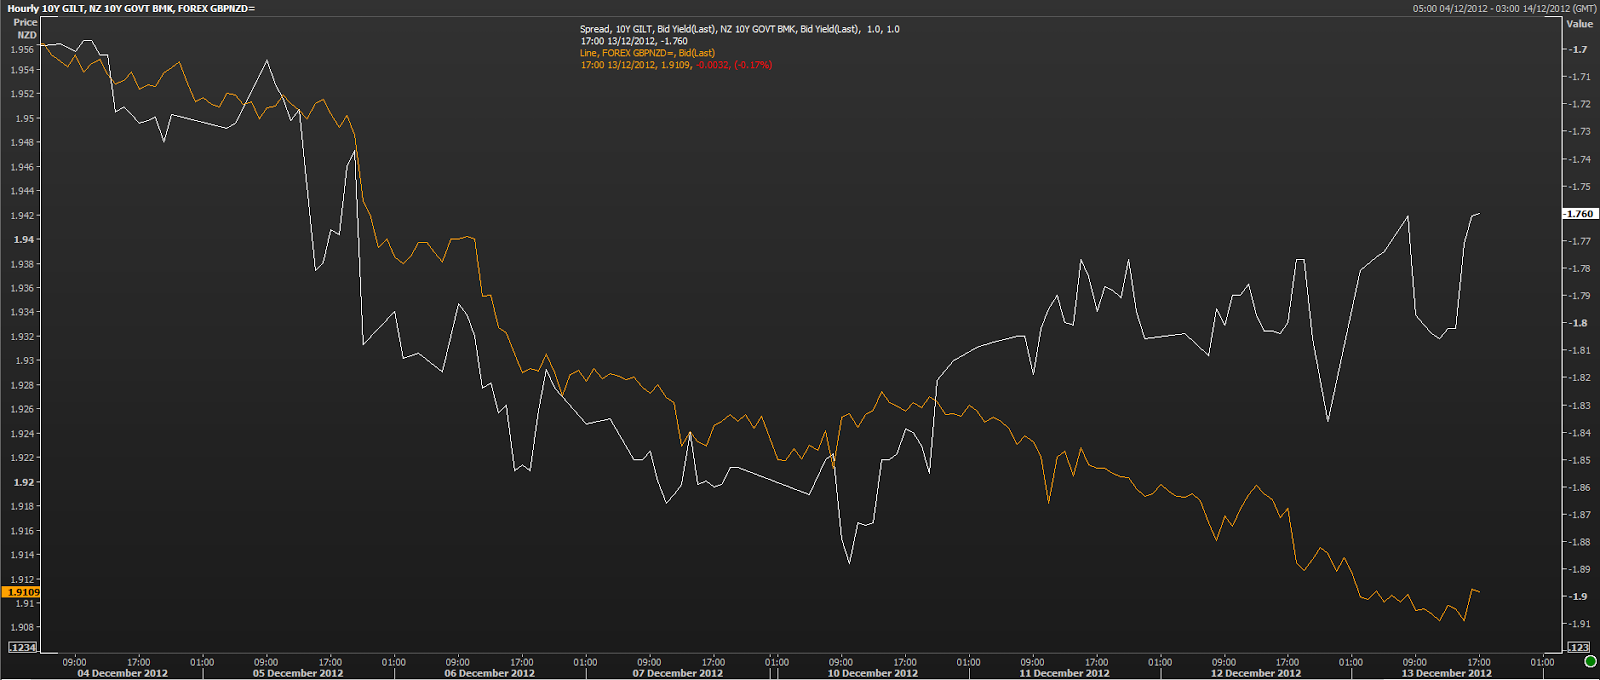
GBPNZD looks ripe for a Reversal from these levels, not only is there strong trendline support but it seems that Credit spreads aren't responding in the same way and a divergence there is occuring. NZD has been going really strong recently and is due for a short period of short covering.

GBPNZD. Thomson Reuters.
Here is GBP-NZD 10Y spread overlayed with GBPNZD exchange rate, they have clearly diverged over the past few days and due for a recoupling.

GBPNZD (Orange/RHS) vs. GBP-NZD 10Y spread (white/LHS)

We recommend Long at 1.91 the levels we see are a move toward 1.9250/55 ( previous swing low which will act as resistance) or a stop on close below 1.8930/50 (previous swing low).

European Market Update

A relatively uninteresting range day across most of Europe with a small sell-off in the early trade before Buying the dip after decent US data.


  • Unemployment claims - Actual 343K // Estimate 369K
  • Retail Sales - Actual 0.3% // Estimate 0.5%
  • SNB - Holding 1.20 Peg saying "it is prepared to buy unlimited quantities of foreign currency to enforce this".

Market Performance 

Forex:
EURUSD - 1.3097 +0.18%
AUDUSD - 1.0550 -0.01%
GBPUSD - 1.6136 -0.06%

Credit:
US 10Y - 1.74% +4 bps
DE 10Y - 1.365% +2.6 bps
GB 10Y - 1.977% +5.8 bps
ES 10Y - 5.4% +7 bps
IT10 Y - 4.63% +5 bps

Equity:
E-mini S&P500 - 1430.00 +0.2%
FDAX - 7603.50 +0.1%
FTSE futures 5936.50 -0.1%

Gold - $1699 -1.1%
Silver - $32.65 -3.35%

Here is an update of yesterday's chart, ES and AUD have yet to converge but it's getting close.
ES vs AUDUSD. Thomson Reuters


FTSEMIB (red/LHS) IBEX (orange/RHS). Thomson Reuters


Spanish and Italian stocks had a particularly good day with the FTSEMIB up 0.85% 


Its up nearly 5.5% since Monday morning


Wednesday, 12 December 2012

Risk FX - E-Mini Spread

The following is an example of How I like to trade short term between two normally highly correlated assets. Here AUDUSD is overlayed with ES and towards the close of New York there was an obvious divergence where AUDUSD didn't fall nearly as much as ES.

As shown by other periods on this chart these two lines do commonly diverge but frequently converge during fundamental releases. This is what I take advantage of.

As mentioned in a previous article, already short AUDUSD from 1.0575 and I expect the two lines to converge, if not fully at least a lot.

Here is where the form of hedging comes in to play, Once short AUDUSD you can open a long ES as a hedge. This will mean your profit and loss will come from the spread between the lines and it's very likely that the spread will tighten.

AUDUSD (red) vs E-mini's (yellow). Thomson Reuters.

In this case I have not longed ES as I am seeing some downside potential especially because of this.

E-Mini (ES) Daily reversal

ES has come hard of the intra-day / post FOMC high and is now negative for the day. As the most important risk barometer, a reversal in ES will lead to lower 10Y yields, Lower AUDUSD rate etc.

Using Candlesticks, if price was to close now (anywhere sub 1431.00) then the Technical pattern "An evening star" where a Daily doji is at the top of a swing high move signalling the top.

Furthermore, ES has pushed back below a daily trendline and this suggests a failed attempt at a move higher.

E-Mini S&P500 Futures, Thomson Retuers
Major Support Levels:

1424 - Last swing high
1415 - Rising trendline
1401 - 38% Fib and Pysch level.

Upside resistance levels:

1438.50/75 - Intra-day highs
1450 - Pysch level
1465 - Major Supply zone.

For this reason we Recommend Shorting at this point, 1430.50, Eventually looking for a move towards 1401 but 1415 is a good start

Post FOMC market Update

Following the Frankly unsurprising FOMC statement, Risk across all markets has decided to pick up. However it seems slightly unsustainable short term.

With Regard to earlier AUD analysis, A break of 1.0625 and close above it will be my sign for a breakout, until then I'm looking for a fakeout move and reversion to <1.05. With this in mind I suggest getting on the short side for the potential of a move down, 1.0575 seems decent value with 60 point stop and 75 point target.

Top left, Clockwise, E-mini, Us 10Y yield, EURUSD, Gold. Thomson Reuters.


Bonus chart -

E-mini and Us 5y Correlation chart, Thomson Reuters

The noticeable spike in correlation was clear after the FOMC statement, Suggesting that algorithms are ruling the market at present. This isn't just in E-mini's and Treasuries but across all markets with USD responding accordingly.